

EVODEVOMICS
2012/10/01
Abstract
Evolutionary developmental biology (evo-devo) is experiencing new insights thanks to the "omics" technologies, giving rise to what I call here evodevomics. In this review, I examine the contribution of "omics" to two related questions: first, can we infer general rules on the evolution of developmental genes and second, does animal development evolve uniformly or are some developmental stages evolving more slowly/rapidly than others? In the first part, I review several findings: i) developmental genes tend to evolve more slowly and they evolve all the more slowly that they are expressed early in development; ii) their expression, and cis-regulatory elements, can be conserved over large phylogenetic scale, and expression differences between related species may be predominantly heterochronic rather than heterometric; iii) the place they occupy in Gene Regulatory Networks, may also impact on the rate of their expression evolution and iv) contrary to expectations, newly arisen developmental genes quickly become essential for the embryo viability. Finally, in the second part, I review how the "omics" approach help to question the funnel versus hourglass models, which are models trying to identify when major developmental constrains take place during development.
Table of Contents
Introduction
High-throughput technologies, also known as "omics" technologies, have tremendously developed during the past decade. The omics approach provide whole-genome data, enabling researchers to investigate organismal evolution at a larger scale than the traditional "one-gene-at-a-time approach" [1, 2]. Cells and organisms can be scrutinised at several levels: genome, transcriptome, proteome [3], epigenome and cistrome (DNA-Transcription Factor interaction) [4] . Figure 1 displays these five methods and gives information on the techniques used to access the data. To my knowledge, only genomic, transcriptomic and proteomic data are currently available to study the evolutionary developmental biology (evo-devo) through comparative studies of developing organisms. The purpose of evo-devo is to identify how development evolve and how this evolution impact organisms morphologies [5].
Formerly, the only tools available for such investigation were the "one-gene-at-a-time" method and the comparative embryology. These methods have revealed that developmental genes are highly pleiotropic, that is to say they are expressed in multiple tissues and/or at different developmental time. Moreover, they have permitted to identify the "genetic toolkit", which is a set of developmental genes highly conserved among organisms, such as the well-known hox genes set. Nowadays, the "omics" give access to new kind of data sets. They allow inferring general rules on the evolution of developmental genes and they bring a different perspective to the studies of animal developmental evolution [6].
In this review, I present an overview of comparative studies of development using genomic, transcriptomic and proteomic data. On one hand, I focus on the evolution of developmental genes at the whole transcriptome level. First I look at how the sequence of developmental genes evolve, then I consider the relationship between the timing of expression and the rate of evolution. Next, I examine the nature of changes in expression (timing versus level), then I take a closer look at their properties when envisioned within complex developmental networks and finally I examine how the rise of novelties is possible. On the other hand, I look at the evolution of animal development, trying to identify if some periods of development evolve more or less rapidly than others.
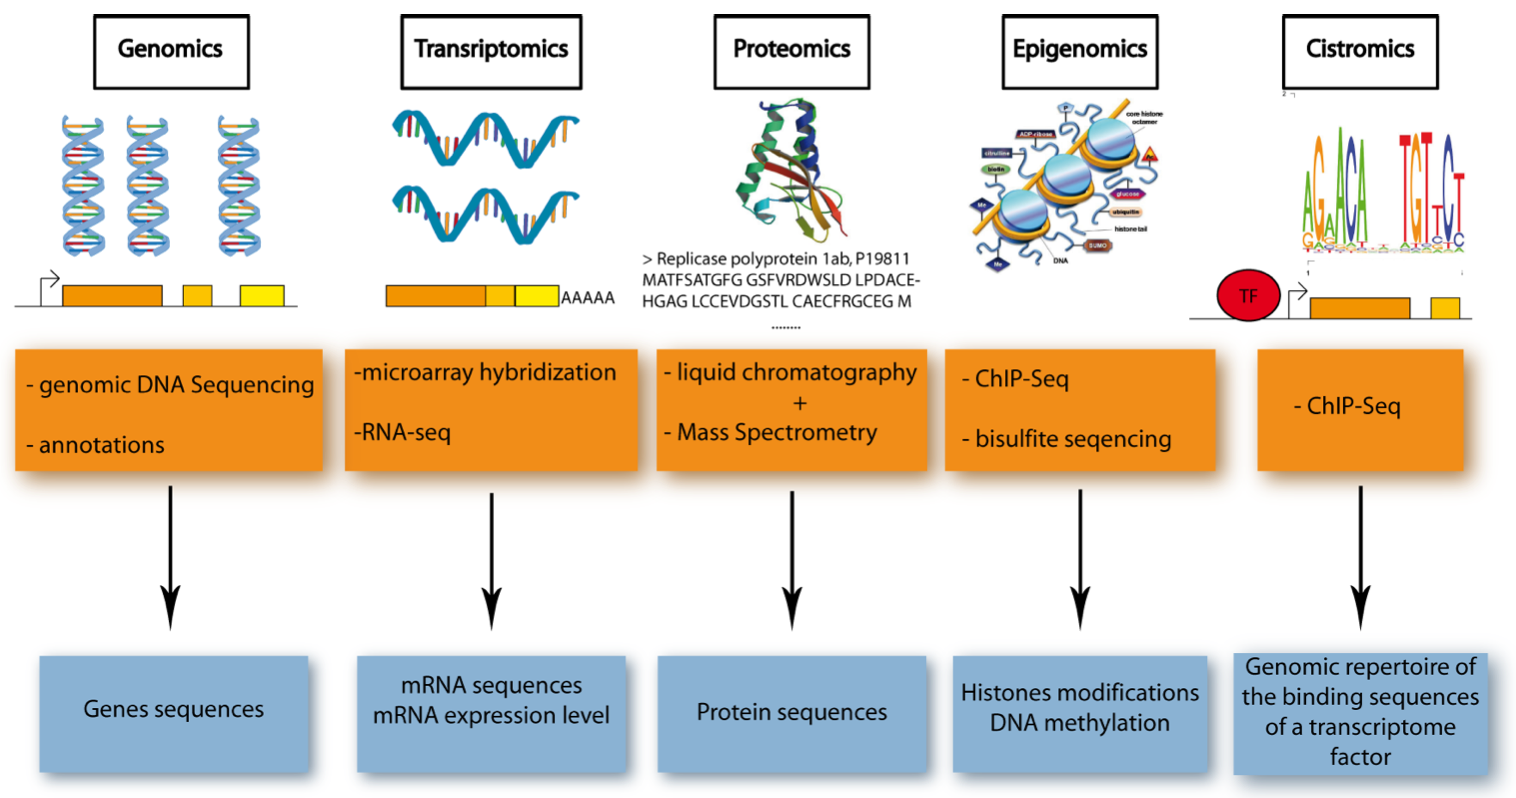
Figure 1. Five Major Omics Technologies. .
Schematic representation of the five omics technologies, focusing on the accessed element (blue) and the methods used (orange). Genomics: access to DNA sequences using gDNA-sequencing and bioinformatics for annotation. Transcriptomics: access to mRNA sequence and level of expression using microarray hybridization or RNA-sequencing. Proteomics: access to protein sequence thanks to liquid chromatography and mass spectrometry. Epigenomics: access to DNA methylation and histone modification (two of the most characterized epigenetic modifications) using ChIP-sequencing or bisulfite sequencing. Cistromics: access to the genomic repertoire of the binding sequences of a transcriptome factor (TF), using ChIP-sequencing.
Specific sequence evolution of developmental genes
Developmental genes evolution
How do developmental genes evolve? This is an intriguing question, implying that developmental genes could evolve differently from other genes. Actually, developmental genes are intrinsically different from other genes, first because they often are essential genes, and second because they are highly pleitropic genes (expressed in multiple tissues). Consequently, developmental genes are thought to be less open to innovation/mutation. For both reasons, an intuitive guess would be that the sequence of developmental genes is highly conserved among species. Does this hypothesis can be verified for whole set of developmental genes?
Although most of the work on the rate of sequence evolution mainly focused on particular gene function categories experiencing adaptive evolution, it is noticeable that development-related genes often display low dN/dS ratio in genome-wide analysis (e.g. Evolution of genes and genomes on the Drosophila phylogeny, by Drosophila 12 Genomes Consortium [7]). In a dedicated study of more than 3,000 orthologous genes in 5 mammalian species, developmentrelated genes turned out to be enriched among genes undergoing purifying selection [8]. Interestingly, similar studies focusing on promoter sequences evolution, demonstrated that development-related genes once again stand out with many adjacent selectively constrained non-coding sites [9,10].
Timing of expression and rate of sequence evolution
We have just seen that the sequence of developmental genes tend to evole slowly as a whole. I will now refine this question by asking whether the rate of sequence evolution depends on the timing of expression during development. Davis et al. [11] studied protein sequence evolution in Drosophila melanogaster and Drosophila pseudoobscura and contrasted it with expression data obtained by Arbeitman et al., [12] by looking at synonymous (Ks) and non-synomymous substitution (Ka). They demonstrated that proteins expressed during early development are highly constrained, since they evolve significantly slower than proteins expressed later during development. By comparing Caenorhabditis elegans and Caenorhabditis briggsae for 12 developmental time points, Cutter and Ward [13] came to a similar conclusion. Indeed, they demonstrate that genes expressed before maturity are more constrained. They suggest that this pattern of sequence evolution could be explained by a mutation-accumulation model of aging, stating that adult-related genes evolve faster than larvae-related genes due to a relaxed selection in adults. Moreover, they demonstrated that transcripts transiently expressed during development evolve faster than other developmental transcripts. This conclusion illustrates the pleitropic constraint at stake by allowing transiently, less pleiotropic genes to evolve faster than other developmental genes expressed in multiple tissues and/or times. Finally, Artieri et al. [14] studied 6 species of the Drosophila melanogaster group, using stage-specific expressed sequence tags (EST). They found a decreasing rate of divergence (dN and dN/dS) over subsequent stages of ontogeny (embryonic<larval/pupal<adult). To explain this pattern, they propose a "constraint-early/opportunity-late" model. The early constraint would be a consequence of the pleiotropy of genes expressed early in the course of development. The "opportunity" refers to the positive selection which is especially strong in adult male gonad genes. In summary, studies in both fly and worm concluded that genes mainly expressed during early development evolve slower than genes expressed later, maybe due to stronger constraints (including pleiotropic constraint). I will come back to this observation and related hypothesis in the second part of the review.
Conservation and Evolution of expression pattern
Parikh et al. [16] studied the transcriptome (RNA-seq data) of two social amoebe: Dictyostelium discoideum and Dictyostelium purpureum that diverged 400 Million years ago and share similar developmental morphologies. They compared the expression profiles of the identified orthologs for 7 time points. They found that these profiles are extremely conserved despite the important evolutionary distance between the genomes of these two distant species. They note that this strong conservation may be explained by the similarities of the two social amoebe development. They conclude that the expression level of developmental genes is greatly conserved, confirming "one-gene-at-a-time" observations. Moreover, they highlight that transcript abundance is correlated between amoeba and Mus musculus, an even greater divergence.
Since expression patterns are conserved, at least to some extent, we can wonder whether cis-regulatory elements controlling gene expression in space and time during development are also conserved. Woolfe et al. [17] found that non-coding elements (CNEs) are greatly conserved among vertebrates. By comparing the genome of human and pufferfish, Fugu rubripes, they identified 1400 highly conserved non-coding sequences, that presented even higher levels of conservation between the two species than coding sequences. Interestingly, these conserved non-coding elements (CNEs) are localised in and around genes that act as developmental regulators. Then, they tested 25 of these CNEs and they found that they display a conserved enhancer activity in multiple tissues. Thus, among others, this study highlighted the deep conservation of some developmental cis-regulatory sequences.
On the other hand, differences in the developmental transcriptome should in principle also account for the large variety of shapes among organisms. In this paragraph I look at two types of possible changes in gene expression over developmental period: heterochrony - a change in spatio-temporal expression - and heterometry - a change in the transcript abundance (Figure 2). I will go through two examples showing that development time is a major determinant of expression variability. In the first paper, Ometto et al. [18], looked at two species of fire ants Solenopsis invicta and S. richteri, and asked which of the sex, caste membership (queens, workers, males), developmental stages (pupae or adult) or species identity better explain variation in gene expression profile (assessed with microarray hybridization data). They found that the major determinant of overall gene expression profile between these two species is developmental stage. In the second paper, Kang et al. [19] studied developmental brain transcriptome evolution in humans by using microarray data. This study is a bit different from the ones already cited as it looked at intra-species variation rather than inter-species variability. However, this is an interesting approach because intra-species variation is the first level on which natural selection may act. All in all the authors analyzed 16 regions for 57 individuals brains, covering a wide range of developmental periods from 4 weeks embryos to elderly people (> 60 years). Kang et al., found that the brain transcriptome presents a complex and dynamic temporal and/or spatial expression pattern at the whole-transcript level but also at the exon level (alternative splicing). As Ometto et al., they conclude that expression differences are better explained thanks to space and time rather than to sex, ethnicities or individuals. This study shows the importance of spatio-temporal pattern in gene expression.
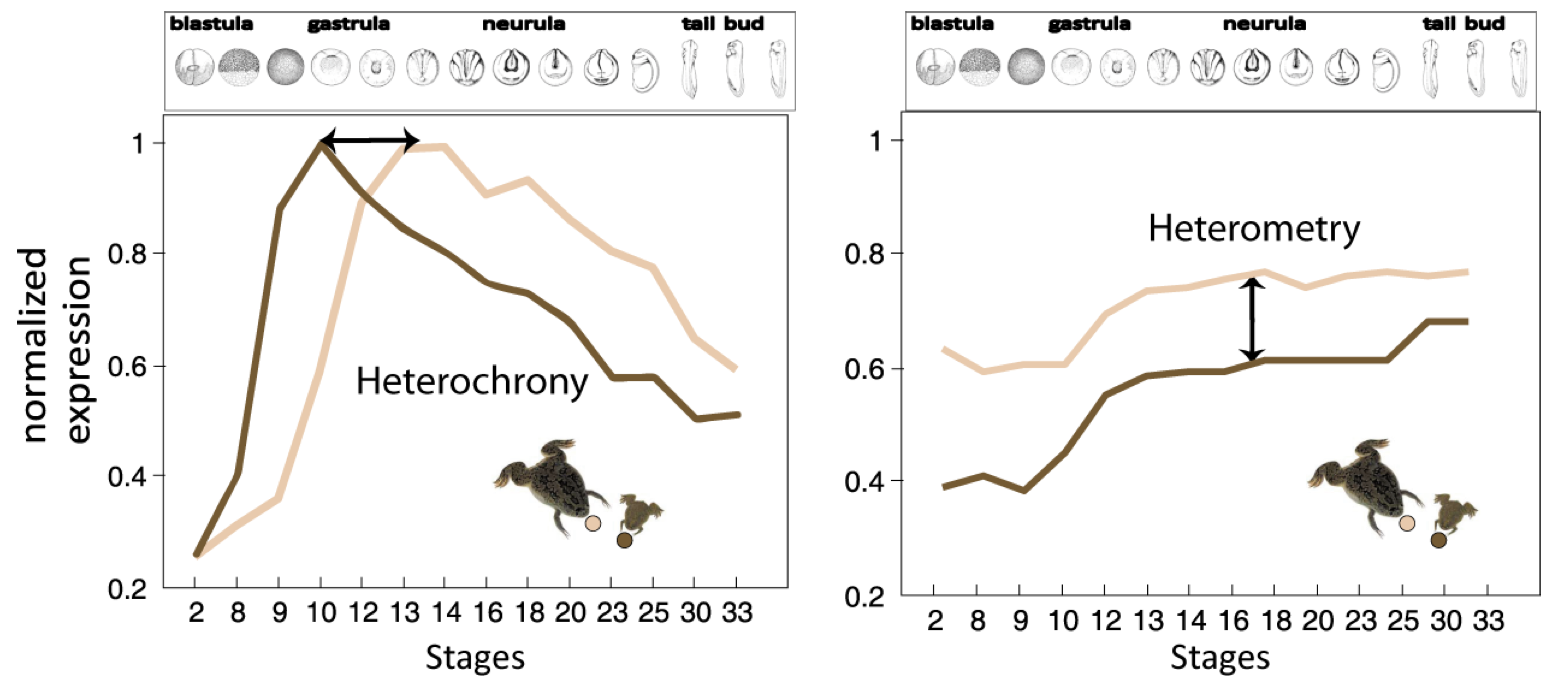
Figure 2. Heterochrony vs. Heterometry..
Illustration of the concepts of heterochrony and heterometry in two clawed frogs: Xenopus laevis (little, dark brown) and Xenopus tropicalis (big, light brown). Normalized expression of two hypothetic transcripts at successive stages of development. The first transcript displays heterochrony: the peak of expression occurs around time point 9 in X. laevis, while it occurs around time point 13 in X. tropicalis. This shows the shift of expression timing of the transcript in the two clawed frogs. The second transcript displays heterometry, it presents the same dynamics of expression in both species but it is less abundant in X. laevis. (Adapted from Yanai et al. [15]).
Yanai et al. [15], rather emphasize the importance of the heterometric factor. They characterized the expression pattern of developmental genes of two amphibians: Xenopus laevis and Xenopus tropicalis. They compared the transcriptome expression pattern at 13 developmental stages using microarray hybridization. They found that the prevalent mode of divergence between these two species is heterometry - transcript abundance -, rather than heterochrony - differences in timing expression. However, this finding shoud be moderated because the results were possibly biased by the particularities of one of the two frogs: indeed X. laevis genome underwent a recent WGD, an event known to be followed by expression level adjustments. Nonetheless, characterization of transcript abundance and spatio-temporal patterning is a key issue to understand transcriptome evolution among species.
Evolution of developmental networks
Gene Regulatory Networks or GRNs are hierarchical networks that regulate the architecture of body plan. Threfore, they are forming the highest level of genes integration. Nowick et al. [20] and Davidson et al. [21] found that the hierarchical organization of GRNs predict different mutational outcomes. Thus, the location of a gene within the network defines different potential of evolution [22]. Moreover, on simulated data, ten Tusscher et al. [23] demonstrate that the evolution of body plan patterning can be achieved without any coding sequence evolution, just by allowing the rewiring of regulatory interactions between a simple set of developmental genes and by allowing duplications. "Omics" have just started giving insight into this exciting field of gene networks' evolution. Sobral et al. [24] studied transcriptome conservation of the ascidian Ciona intestinalis and the zebrafish Danio rerio, two organisms that share a similar larval body plan. They used genome data to construct groups of orthologous genes and thanks to a database of in-situ hybridization available for both organisms, they looked at the spatio-temporal evolution of gene expression. They found a great divergence of the transcriptional program despite the fact that these two organisms share a common larval body plan. In order to explain this morphological similarity they suggested that small islands of conservation, or "kernels", were still present in the transcriptional network, and that they alone are sufficient to constrain body plans. Rifkin et al. [25] performed DNA microarray analysis on the transcriptome of 6 Drosophila species: D. simulans, D. yakuba and 4 strains of D. melanogaster at the begining of metamorphosis. In this dataset, the expression profile of regulatory genes, such as transcription factors, is better conserved than those of their downstream target. Wagner et al. [26] compared expression time-series analyses (estimated by microarray data) during mouse and Drosophila embryogenesis. They observed a strong conservation in expression profiles for whole classes of genes. For example, in both species, the expression of metabolic genes peaks just before "birth". In conclusion, the expression profile of orthologs genes may be quite divergent between species, whereas, the expression pattern of whole class of genes seems highly conserved even among divergent species such as mouse and Drosophila.
Evolving new developmental genes
In this paragraph, I look at different mechanisms allowing the emergence of new developmental genes. Despite the great conservation of the developmental gene repertoire, some parts of the developmental gene set necessary differ, given the large variety of shapes displayed among organisms.
One of the mechanisms allowing gene set divergence is duplication at the level of single-gene or whole genome (whole genome duplication or WGD). If both copies are retained after a duplication, they enter several (non-exclusive) models, namely dose effect (heterometry), sub-functionalization and neofunctionalization. The Walsh model [27] proposed that new duplicate genes can quickly evolve a novel and important function by accumulating advantageous mutation. Firstly, in order to identify gene duplicates retained from the teleost-specific WGD, Kassahn et al. [28] compared the genome of five teleost fishes: D. rerio, T. rubripes, T. nigroviridis, medaka (Oryzias latipes), and stickleback (Gasterosteus aculeatus). They found that at least 4% of genes have been retained in duplicate. Secondly, they compared the protein domain architecture of zebrafish duplicates to their single mouse orthologs and found many examples of neofunctionalization. The reason why I choose to cite this particular paper on WGD among others, is because the authors study the impact of WGD (Whole Genome Duplication) on the expression pattern of developmental genes. They interestingly found that "87% [of developmental genes retained in two copies] differed in expression localization during at least one developmental stage, while only 13% shared the same expression domain during all developmental stages investigated thus far". This observation lead them to conclude that WGD enable more specialized regulatory control of development via the acquisition of novel spatio-temporal expression.
A striking discovery was made recently about the importance of new/young genes in development. Actually, essential genes are frequently thought to be very conserved and ancient, while younger genes have been considered to perform minor organismal function. Chen et al. first identified 195 young protein-coding genes newly arisen in the genome of 12 closely related Drosophila species. They found that 30% of them affected the viability of the embryo when knock-down using RNAi silencing. This analysis lead the authors to conclude that new genes rapidly evolved essential functions and are recruited shortly after birth in the developmental process. In conclusion, developmental genes undergo a strong purification selection, with conservation of certain set of genes. At the same time, diversifying selection allow the emergence of new genes and new expression patterns.
Evolution of developmental process
The theoretical framing of development
When comparing embryos of different species, it has long been noticed that they shared striking similarities at particular stages of their development but not at others. This observation was recorded as the von Baer's third law. Actually, in 1828 von Baer stated that early developmental stages of vertebrate embryos resemble each other. The phylotypic period is the name given at this particular morphologically conserved stage, and it is thought to occur at mid-embryogenesis when vertebrate more closely resemble each other. Similarities/conservation among organisms at large phylogenetic scales are thought to result from functional constraints in developmental mechanisms. These functional constraints limit the amount of possible changes, because most changes will be eliminated by negative selection. For example, pleiotropic genes are thought to be more constrained than non pleiotropic genes, because mutations in these genes are most likely to cause deleterious, counter-selected phenotypes. Reciprocally, divergences can result from the relaxation of negative selection, or alternatively from positive selection (adaptation). Von Baer observation rise the question whether some stages of development are more variable than others, either because of differences in the level of developmental constrains or in the level of adaptation. This questioning on developmental stages conservation is actually summarized in two major models: the funnel model and the hourglass model [29]. The funnel model primarily focuses on constraints, that would be decreasing throughout development. Due to the cumulative nature of development, small changes in early steps will tend to have a tremendous impact on the adult phenotype and be counterselected. Early development should thus be more constrained than later steps of development. The hourglass model was designed to fit with von Baer morphological observation. It has been proposed that it could be explained by combining a funnel-like constraint with strong positive (diversifying) selection acting on earliest steps of embryogenesis, because these early steps are strongly dependent on the occupied ecological niche. Alternatively, constraints (negative selection) may just reach a maximum at mid-embryogenesis. And finally, the end of development is characterized by a relaxation of the negative selection. The emergence of omics data enable to investigate these two models by studying transcriptome conservation. In this section, I examine several recent studies on this topics and the various methods developed to answer this question.
Studies in favour of the funnel-like model
Roux and Robinson-Rechavi [30] tried to identify constraints acting during embryonic development. They characterized the constraints acting on the transcriptome of two vertebrate genomes: mouse and zebrafish. For mouse, they used EST (expressed sequence tag) data covering 26 stages, and for zebrafish they used microarray data covering 14 developmental time points. They found that genes expressed early during embryogenesis are more constrained and thus less likely to change. Accordingly, knock-out or mutation effect are more deleterious when they target genes expressed early in development. Moreover, after Whole Genome Duplication genes expressed early tend to be retained in single copy. Finally, they pointed out that after reaching a maximum at the beginning of development, genomic constraints decrease monotonously throughout development. Comte, Roux and Robinson-Rechavi [31] looked at protein-protein interaction (measuring protein connectivity) and miRNA levels, two independent estimations of the level of gene interactions at different stages. Then, they studied the conservation of gene expression between zebrafish and mouse, by using microarray data. They found that the decrease of constraint over development was not monotonous, in fact they observed some peaks of conservation. Nevertheless, these peaks do not correspond to the phylotypic stage, the stage for which morphological similarities are observed. No clear signature, neither in protein-interaction, nor in miRNA levels could be observed during the phylotypic stage. The absence of any kind of signature determining the phylotypic stage lead the author to conclude that morphological similarities is a convergent result of an early genetic conservation and thus favor a funnel-like model.
Studies in favour of the hourglass model
Irie et al. [32] developed the ancestor index. They applied this tool to the mouse transcriptome (EST data) and precisely look at the vertebrate ancestor index. The vertebrate ancestor index is a ratio calculated from the number of non-redundant vertebrate genes expressed at stage k, over the number of non-redundant total genes expressed at same stage k. Vertebrate genes are the genes that have at least one homologue in protostome, urochordate, teleost and amphibians. They hypothesized that the phylotypic stage should be the stage the most enriched in conserved vertebrate genes. They found that the highest ratio of vertebrate ancestor index occurs at mid-embryogenis during the pharyngula stage, thus supporting the existence of a highly constrained stage, -the phylotypic period-, during mid-embryogenesis. Domazet-Loso et al. [33] proposed to calculate the age of the transcriptome set at different developmental stages. The transcriptome age index (TAI) takes into consideration the relationships between development and evolution [34, 29]. They applied this calculation to the transcriptome of zebrafish and Drosophila, obtained by microarray hybridization. They hypothesized that the phylotypic stage, as it is supposed to be very conserved, would exhibit the oldest transcriptome set, or in other words the smallest TAI. For both species, they found that the smallest TAI occurs at mid-embryogenesis, more precisely between segmentation and pharyngula stage in zebrafish, and between germ band elongation and germ band retraction for Drosophila. Moreover, they noted that earlier and later stages display the younger transcriptome sets. Kalinka et al. [35] quantified gene expression divergence in 6 Drosophila species: D. melanogaster, D. simulans, D. ananassae, D. pseudoobscura, D. persimilis, D. virilis. To access their transcriptome they used species-specific microarrays covering 8 developmental time points at 2-h intervals starting from 0-2h to 14-16h. They found that the divergence among species is reduced at mid-embryonic stages (8-10h) and that selective constraint increases at this stage. So, mid-embryonic stages seem to show the signature of a phylotypic stage. Moreover, Kalinka et al. noted that genes that best fitted the hourglass shape are involved in key developmental process, thus underlying the importance of the phylotypic stage in the developmental process. Finally, Irie et al. [36], performed a quantitative comparative transcriptome analysis among 4 vertebrates: Mus musculus, Gallus gallus, Xenopus laevis, Danio rerio. The data, obtained by microarray hybridization, shows that the pharyngula stage is more conserved among species than any other stages. Thus arguing once again in favor of the hourglass model.
These results are summarised in the figure 3. Obviously, the debate between hourglass versus funnel model is still open as the conclusion reached varies, depending on the methodology used.
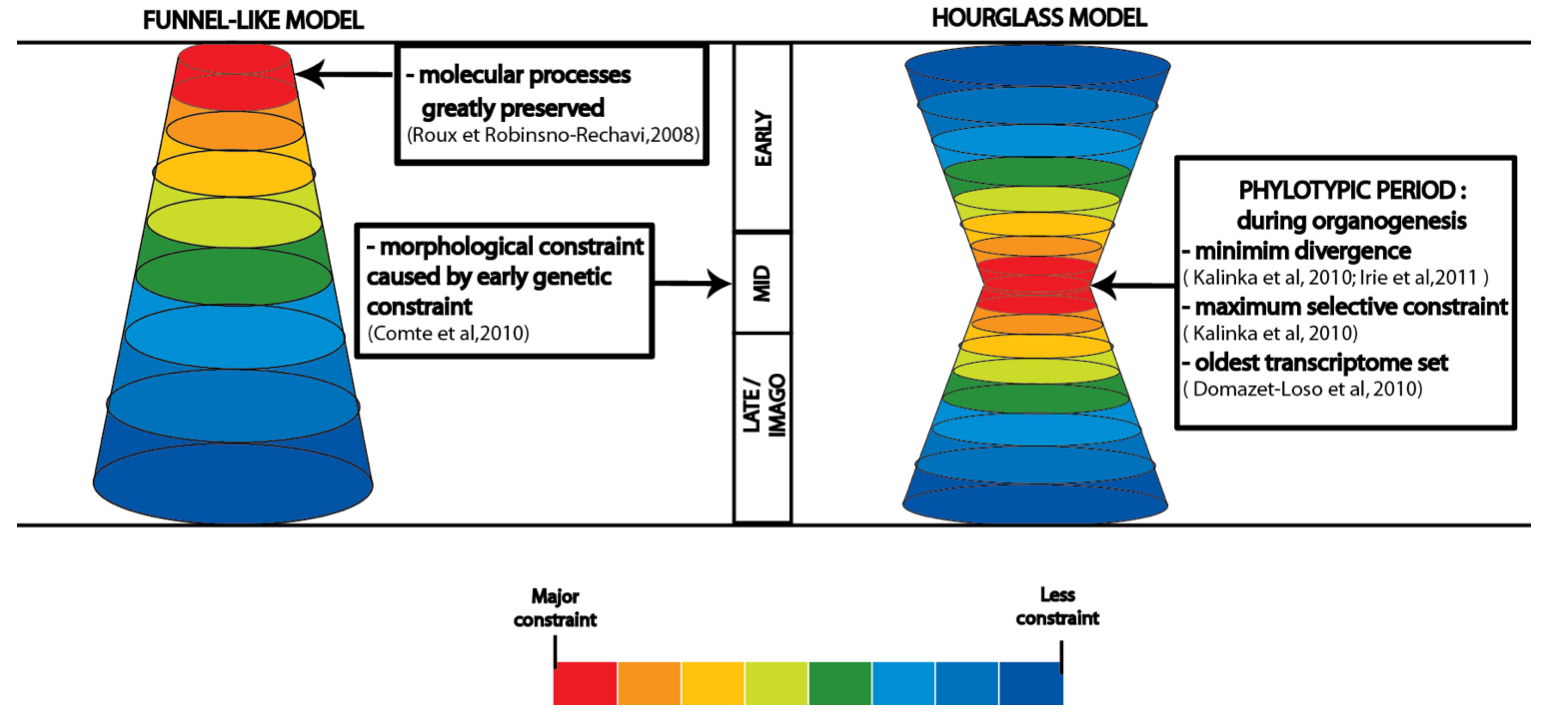
Figure 3. Major models of developmental constraint. .
Presentation of the two major models for the identification of stages greatly constrained in development. In the funnel-like model, constraint is greater during early stages of embryogenesis and decreases throughout development. The high morphological similarities during mid-embryogenesis result from this early genetic constraint. In the hourglass model, greater conservation occurs at mid-embryogenesis, named the phylotypic period, during organogenesis when the body plan is defined. Whereas early and late embryogenesis are less constrained due to ecological adaptation at the beginning of embryogenesis and pleiotropic constraint plus mutation-accumulation model of aging at late embryogenesis and imago period. The strength of the constraint is presented with different colors, ranging from red for high constraint, yellow-green for medium constraint to blue for weak constraint.
Conclusion
"Omics" technologies offer great evolutionary insights for the evo-devo studies. They are powerfull tools to be used in parallels with the "classic" methods. Thanks to "omics" technologies, the power of comparative approach benefits from being tackled at the level of genome, transcriptome and proteome. "Omics" studies are only at the begining of their potentiality but they already led interesting results on overall conservation and variation observed among organisms. Sometimes, they just confirmed our expectation and sometimes they shed new light on certain subjects. An interesting use of omics technology would be a genome-wide study on cis-regulatory sequence divergence which is a possible mechanism for the rise of novelties, that allow to bypass the pleiotropic constraint, which constrained the divergence of genes expressed in multiple tissue. To my knowledge, no such study have been carried out on the evolution of cis-regulatory sequences throughout development. However, Fraser et al. [37] found the first cases of positive selection on cis-regulatory sequences in two subspecies of Mus musculus. They obtained expression profile using microarray hybridization The novelty of their approach is to combine QTL data with expression data, the eQTL. eQTL allow to identify cis-regulatory sequences under positive selection. Still we lack information on how natural selection may act on cis-regulation across entire developmental networks. In addition, high-throughput technologies make it possible to question the integrative aspect of evo-devo and to conduct tests at a the developmental process level. For example, it brings new insights into the controversy between funnel-like and hourglass model. Despite the emergence of new arguments for each model, the debate is still open. Actually, a better understanding of GRNs evolution could shed new light on the debate between funnel-like and hourglass model. In fact, studying constraint distribution and conservation within the subcircuits of GRNs could bring valuable information on the conservation of body plans and divergence within species. In brief, evodevomics is at the beginning of its potentiality for answering evo-devo questions. It has yet allows to better understand how constraints apply throughout development at different levels ranging from the developmental gene evolution to the evolution of the developmental process.
References and recommended reading
Papers of particular interest have been highlighted as:
● of special interest
●● of outstanding interest
1.C. Chen, P. B. McGarvey, H. Huang, and C. H. Wu. Protein bioinformatics infrastructure for the integration and analysis of multiple High-Throughput “omics” data.Advances in Bioinformatics2010, 2010:1–19.
2.A. R. Joyce and B. |. Palsson. The model organism as a system: integrating 'omics' data sets.Nature Reviews Molecular Cell Biology 2006, 7:198–210.
3.N. Veldhoen, M. G. Ikonomou, and C. C. Helbing. Molecular profiling of marine fauna: Integration of omics with environmental assessment of the world's oceans.Ecotoxicology and Environmental Safety 2012, 76:23–38.
4.A. Ozdemir, K. I. Fisher-Aylor, S. Pepke, M. Samanta, L. Dunipace, K. McCue, L. Zeng, N. Ogawa, B. J. Wold, and A. Stathopoulos. High resolution mapping of twist to DNA in drosophila embryos: Efficient functional analysis and evolutionary conservation.Genome Research 2011, 21:566–577.
5.G. B. Müller. Evo-devo: extending the evolutionary synthesis.Nature Reviews Genetics 2007, 8:943–949.
6.D. A. Garfield and G. A. Wray. Comparative embryology without a microscope: using genomic approaches to understand the evolution of development.Journal of Biology 2009, 8(7):65.
7.A. G. Clark. Evolution of genes and genomes on the Drosophila phylogeny.Nature 2007, 450:203–218.
8.K. Hanada, S. Shiu, and W. Li. The Nonsynonymous/Synonymous Substitution Rate Ratio Versus the Radical/Conservative Replacement Rate Ratio in the Evolution of Mammalian Genes.Molecular Biology and Evolution 2007, 24:2235–2241.
9.D. J. Gaffney and P. D. Keightley. Genomic Selective Constraints in Murid Noncoding DNA.PLoS Genet 2006, 2:e204.
10.M. M. Hoffman and E. Birney. An Effective Model for Natural Selection in Promoters.Genome Research 2010, 20:685–692.
11.J. C. Davis, O. Brandman, and D. A. Petrov. Protein evolution in the context of drosophila development.Journal of Molecular Evolution 2005, 60:774–785.
12.M. N. Arbeitman, E. E. M. Furlong, F. Imam, E. Johnson, B. H. Null, B. S. Baker, M. A. Krasnow, M. P. Scott, R. W. Davis, and K. P. White. Gene expression during the life cycle of Drosophila melanogaster.Science 2002, 297:2270 –2275.
13.A. D. Cutter and S. Ward. Sexual and temporal dynamics of molecular evolution in C. elegans development.Molecular Biology and Evolution 2005, 22:178 –188. ● A charaterization of protein-coding sequences evolution rate in
C.elegans over 12 developmental time points which
revealed the slower rate of genes expressed before maturity and the higher rate
of genes expressed only transiently (i.e. weakly pleiotropic).
14.C. G. Artieri, W. Haerty, and R. S.
Singh. Ontogeny and phylogeny: molecular signatures of selection,
constraint, and temporal pleiotropy in the development of Drosophila.BMC Biology 2009, 7:42. ● A constraint-early/opportunity-late model is suggested to explain the
gradient in sequence evolution rate observed between genes expressed at
subsequent stages of development (embryonic<larval/pupal<adult) of 6
Drosophila species. This model is however questionable
since only 3 stages of development were looked at and the larval/pupal<adult
signature is mainly driven by the high rate of male gonadal genes.
15.I. Yanai, L. Peshkin, P. Jorgensen,
and M. W. Kirschner. Mapping gene expression in two Xenopus species: Evolutionary constraints and
developmental flexibility.Developmental Cell 2011, 20:483–496. ● Comparison of 13 developmental time points of the two clawed frog
Xenopus laevis and Xenopus
tropicalis lead to the unexpected conclusion that heterometry
(transcript abundance) better explains species divergence than heterochrony
(temporal shifts in transcript expression).
16.A. Parikh, E. R. Miranda, M.
Katoh-Kurasawa, D. Fuller, G. Rot, L. Zagar, T. Curk, R. Sucgang, R. Chen, B. Zupan, W.
F. Loomis, A. Kuspa, and G. Shaulsky. Conserved developmental
transcriptomes in evolutionarily divergent species.Genome Biology 2010, 11:R35. ● The comparative analysis of two social amoebe transcriptomes revealed a
surprising conservation, despite the huge evolutionary distance. This
conservation could possibly be explained the morphological similarity of the two
species.
17.A. Woolfe, M. Goodson, D. K. Goode, P. Snell, G. K. McEwen, T. Vavouri, S. F. Smith, P. North, H. Callaway, K. Kelly, K. Walter, I. Abnizova, W. Gilks, Y. J. K. Edwards, J. E. Cooke, and G. Elgar. Highly Conserved Non-Coding Sequences Are Associated with Vertebrate Development.PLoS Biol 2004, 3:e7.
18.L. Ometto, D. Shoemaker, K. G. Ross, and L. Keller. Evolution of gene expression in fire ants: The effects of developmental stage, caste, and species.Molecular Biology and Evolution 2011, 28:1381 –1392.
19.H. J. Kang, Y. I. Kawasawa, F.
Cheng, Y. Zhu, X. Xu, M. Li, A. M. M. Sousa, M. Pletikos, K. A. Meyer, G. Sedmak, T.
Guennel, Y. Shin, M. B. Johnson, Z. Krsnik, S. Mayer, S. Fertuzinhos, S. Umlauf, S. N.
Lisgo, A. Vortmeyer, D. R. Weinberger, S. Mane, T. M. Hyde, A. Huttner, M. Reimers, J.
E. Kleinman, and N. Sestan. Spatio-temporal transcriptome of the
human brain.Nature 2011, 478:483–489. ● This study performed a huge work by gathering transcriptome data on 16
regions of 57 human brains at different developmental times ranging from 4 weeks
embryos to elderly people. Transcriptome divergence is better explained by space
and time of expression rather than sex or individuals.
20.K. Nowick and L. Stubbs. Lineage-specific transcription factors and the evolution of gene regulatory networks.Briefings in Functional Genomics 2010, 9:65–78. [PubMed] [PMCID: 3096533]
21.E. H. Davidson and D. H. Erwin. Gene regulatory networks and the evolution of animal body plans.Science 2006, 311:796 –800.
22.D. H. Erwin and E. H. Davidson. The evolution of hierarchical gene regulatory networks.Nature Reviews Genetics 2009, 10:141–148.
23.K. H. ten Tusscher and P. Hogeweg. Evolution of networks for body plan patterning; interplay of modularity, robustness and evolvability. 2011, vol. 7, Oct. 2011.
24.D. Sobral, O. Tassy, and P.
Lemaire. Highly divergent gene expression programs can lead to
similar chordate larval body plans.Current Biology 2009, 19:2014–2019. ● The ascidian, Ciona intestinalis, and the zebrafish,
Danio rerio, present a poor expression conservation
pattern despite their similar larval body plan.
25.S. A. Rifkin, J. Kim, and K. P. White. Evolution of gene expression in the Drosophila melanogaster subgroup.Nat Genet 2003, 33:138–144.
26.R. A. Wagner, R. Tabibiazar, A. Liao, and T. Quertermous. Genome-wide expression dynamics during mouse embryonic development reveal similarities to Drosophila development.Developmental Biology 2005, 288:595–611.
27.S. Chen, Y. E. Zhang, and M. Long.
New genes in Drosophila
quickly become essential.Science 2010, 330:1682 –1685. ● This exciting recent study presents the systematic detection and
silencing (through RNAi) of new genes in the 12 sequenced
Drosophila genomes and shows that 30% of these genes
are essential for the embryo's viability. This study revolutionize the way of
thinking development evolution by showing that young genes are as essential as
old genes.
28.K. S. Kassahn, V. T. Dang, S. J. Wilkins, A. C. Perkins, and M. A. Ragan. Evolution of gene function and regulatory control after whole-genome duplication: Comparative analyses in vertebrates.Genome Research 2009, 19:1404 –1418.
29.B. Prud'homme and N. Gompel. Evolutionary biology: Genomic hourglass.Nature 2010, 468:768–769.
30.J. Roux and M. Robinson-Rechavi. Developmental constraints on vertebrate genome evolution.PLoS Genetics 2008, vol. 4, Dec. 2008. [PubMed] [PMCID: 2600815]
31.A. Comte, J. Roux, and M.
Robinson-Rechavi. Molecular signaling in zebrafish development and
the vertebrate phylotypic period.Evolution & Development 2010, 12:144–156. ● No molecular signature of the phylotypic period could be identified in
zebrafish, leading the author to conclude that the phylotypic stage is the
convergent result of strong constraints on earlier stages.
32.N. Irie and A. Sehara-Fujisawa. The vertebrate phylotypic stage and an early bilaterian-related stage in mouse embryogenesis defined by genomic information.BMC Biology 2007, 5:1.
33.T. Domazet-Loso and D. Tautz.
A phylogenetically based transcriptome age index mirrors
ontogenetic divergence patterns.Nature 2010, 468:815–818. ● Using a new tool: the transcritpome age index (TAI) which allow to
estimate the age of the transcriptome set at different developmental time
points, the authors show that the oldest transcriptome set is expressed during
mid-embryogenesis in zebrafish and Drosophila and thus give
a support to the hourglass model.
34.T. Domazet-Lošo, J. Brajković, and D. Tautz. A phylostratigraphy approach to uncover the genomic history of major adaptations in metazoan lineages.Trends in Genetics 2007, 23:533–539.
35.A. T. Kalinka, K. M. Varga, D. T.
Gerrard, S. Preibisch, D. L. Corcoran, J. Jarrells, U. Ohler, C. M. Bergman, and P.
Tomancak. Gene expression divergence recapitulates the
developmental hourglass model.Nature 2010, 468:811–814. ● Developmental transcriptome divergence between 6
Drosophila species is smallest during
mid-embryogenesis.
36.N. Irie and S. Kuratani. Comparative transcriptome analysis reveals vertebrate phylotypic period
during organogenesis. 2011, 2:248–. ● Pharyngula stage of mouse, chicken, zebrafish and clawed frog present a
better expression profile conservation than any other stage of
development.
37.H. B. Fraser, T. Babak, J. Tsang, Y. Zhou, B. Zhang, M. Mehrabian, and E. E. Schadt. Systematic detection of polygenic cis-Regulatory evolution. PLoS Genetics2011, vol. 7, Mar. 2011. [PubMed] [PMCID: 3069120]
